Bit #26: First experiment: how fast does AI power move?
Four hours of measured GPU power, seven predictions, and a simulation of miners and capacitors
This post describes the first experiment of the project. The first post explains why the project exists. The experiment asked one question: when a GPU serves AI requests at the pace of real traffic, how fast does its power change?
What I did
- Hardware: I rented one NVIDIA H100 80 GB GPU on vast.ai. The rental ran on September 8 and 9, 2026.
- Model and server: the GPU ran the Qwen3-8B language model at 16-bit precision, served by vLLM version 0.28.0.
- Request timing and sizes: I used the Azure LLM inference traces, which Microsoft publishes under a CC-BY licence. Each request in the traces records its arrival time, the length of its prompt and the length of its answer. The traces do not contain the text of the requests. I took the busiest hour of each of two traces. The chat trace's busiest hour is Tuesday at 9:00 AM Central time and holds 269,237 requests. The coding-assistant trace's busiest hour is Wednesday at 2:00 PM Central time and holds 301,105 requests.
- Request content: each prompt I sent was a list of random tokens with the recorded prompt length. The server was told to keep generating each answer until it reached the recorded answer length. The arrival times, the prompt lengths and the answer lengths came from the traces. The words did not.
- Thinning: one GPU cannot serve a whole data center's traffic. I kept every 6th chat request and every 11th coding request, and I kept their original arrival times. The GPU served 44,873 chat requests and 27,374 coding requests in the main runs.
- Runs: I made four one-hour runs. Two were the main runs, one for chat and one for coding. The third repeated the chat hour with every 12th request kept, which is half the load. The fourth repeated the coding hour with a smaller vLLM prefill budget (the
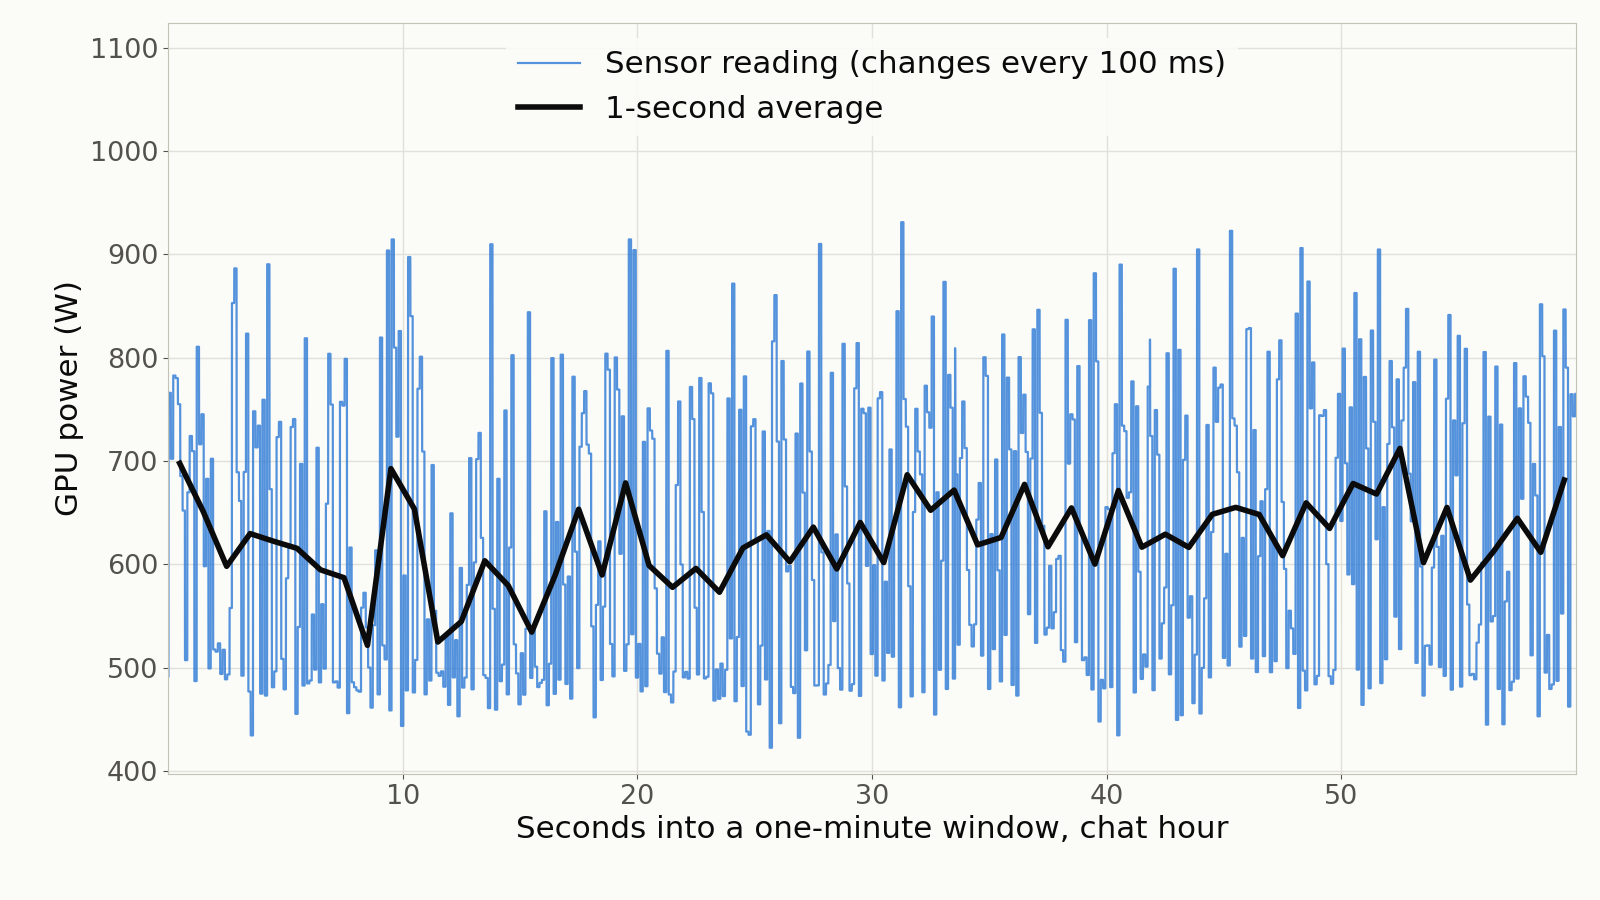
--max-num-batched-tokenssetting, cut from 8,192 to 512 tokens). - Power logging: a logger read the GPU's power sensor through NVIDIA's management library about 1,000 times per second. During the four runs the sensor itself changed value every 100 ms. The shortest time step that this experiment can resolve is therefore a tenth of a second.
The predictions, and the results
Before the run I wrote down seven predictions. I wrote them first so that a result could not be explained after the fact. Three predictions held and four were wrong.
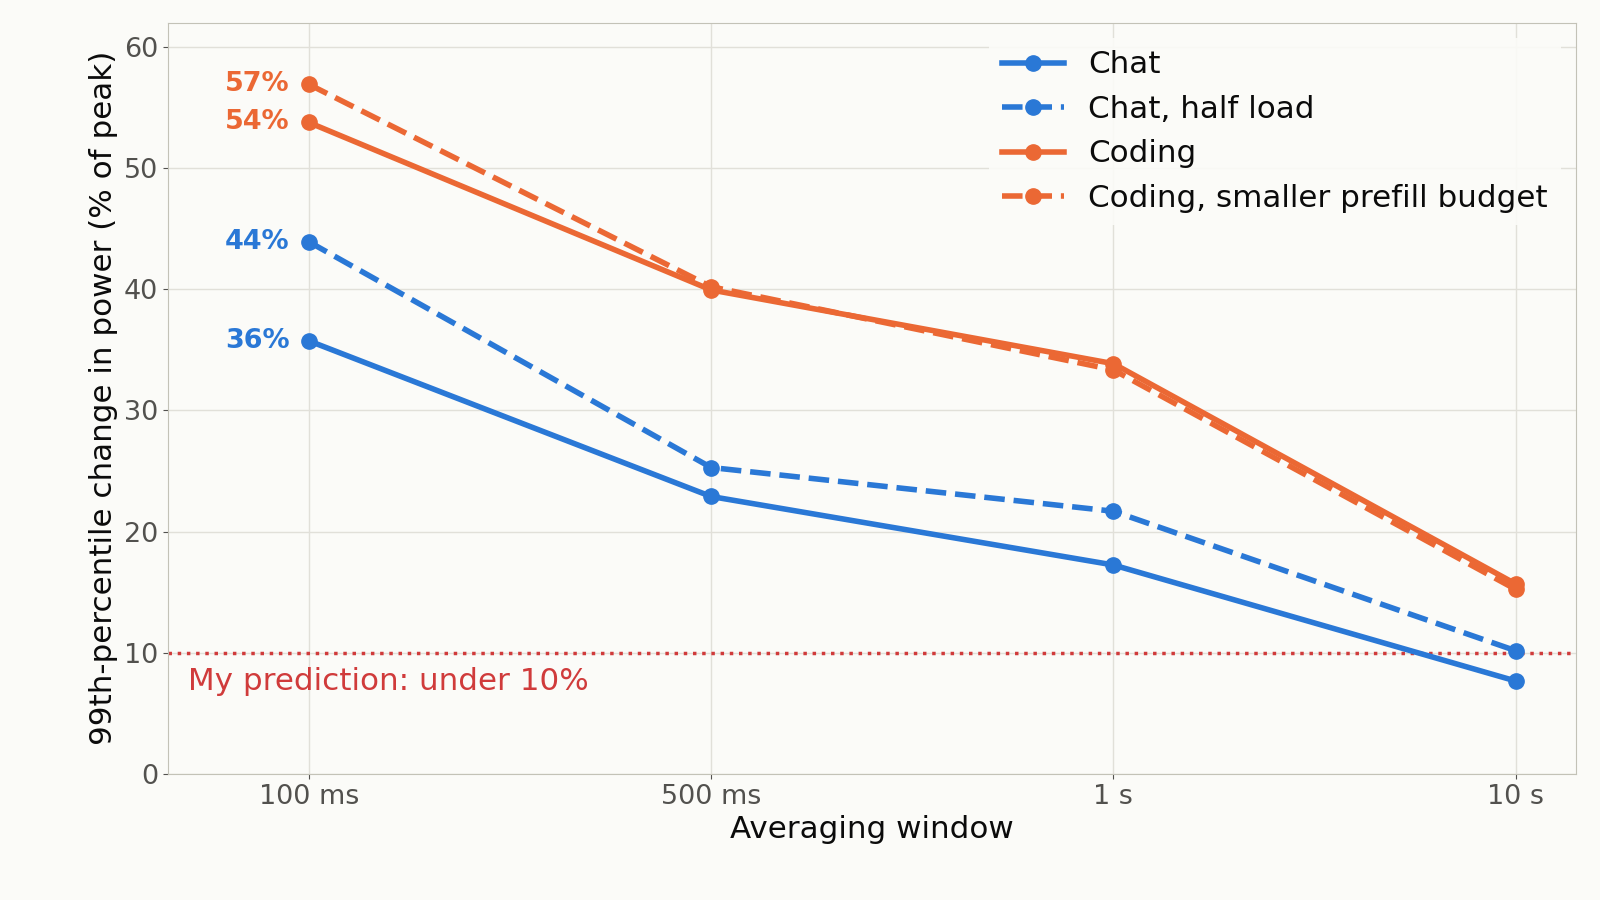
- Wrong. I predicted that the 99th-percentile power change over a tenth of a second would be under 10% of peak power. It was 36% of peak on the chat hour and 54% on the coding hour.
- Held. I predicted that the coding hour would show larger relative power changes than the chat hour at every averaging window. It did.
- Wrong. I predicted that the power sensor would update at least 25 times per second under load. In a separate two-minute test made for this check, it changed value 16.2 times per second on average.
- Wrong. I predicted that power would follow the number of answers being generated at once more closely than it follows request arrivals. I did not measure that number directly. I reconstructed it from the requests, using an assumed generation time of 47.16 ms per token. Over one-second intervals on the chat hour, power correlated with the reconstructed number at r = 0.28, with request arrivals at r = 0.42, and with the number of prompt tokens arriving at r = 0.58. Power is more closely related to when requests arrive and how long their prompts are. The strongest of these correlations, 0.58, still accounts for only about a third of the variation in power.
- Held. I predicted that halving the chat load would change the relative power changes by less than a factor of two. The ratio between the two runs was 1.23 at a tenth of a second and 1.26 at one second.
- Held. I predicted that an idle GPU's tenth-of-a-second power changes, as a share of the chat hour's peak, would be less than one-third of the chat hour's own share. The idle value was 0.12% of peak. The limit was 11.9%. This check used only a clean 269-second stretch of the idle recording, because an unrecorded process on the rented machine disturbed the rest of it.
- Wrong. I predicted that the smaller prefill budget would reduce the coding hour's tenth-of-a-second power changes, as a share of peak, by at least 10% of their value. The share rose from 53.8% to 56.9% of peak, which is 5.9% higher. In watts, the 99th-percentile change was 524 W with the default budget and 525 W with the smaller one. The share rose because that run's peak power was lower, 922 W against 975 W. At this operating point, the prefill budget did not change the size of the power changes by a measurable amount.
The numbers, with their definitions
The same hour gives different percentages under different definitions, so each figure below comes with its definition.
- Over a tenth of a second: I split each hour into 100 ms intervals and took the change in average power from one interval to the next. In 1 interval out of 100, the change was at least 36% of the peak 100 ms power on the chat hour, where the peak was 976 W. On the coding hour it was at least 54%. The sensor holds each value for 100 ms, so it cannot show faster changes. The true changes are at least this large.
- Over one second: the same measure on 1-second averages gives 17% on the chat hour and 34% on the coding hour. Those percentages are of the peak 1-second average, which is lower: 766 W on the chat hour and 749 W on the coding hour. In watts the changes are about 132 W and 254 W.
- A distortion in the request timing: the arrival times in the Azure traces are recorded to the microsecond, but they follow a pattern that repeats every quarter of a second. Arrivals cluster in some parts of each quarter second and are missing from others. In the coding trace, for example, no request arrives in the last 62.5 ms of any quarter second. My replay kept those times, so the GPU's load rose and fell four times per second. I found this after the run. It may make the tenth-of-a-second figures larger than real traffic would make them. For the chat hour, the four-per-second pattern accounts for about 5% of the variation in power. If that part and the rest of the variation are independent, the pattern raises the 99th-percentile change by about 2%. If the two always add in the same direction at the largest changes, it raises it by at most about 19%. I have not made the same estimate for the coding hour.
A simulation of miners and capacitors
Luxor publishes how long its software takes to switch a miner down. Nobody has published how long a mining chip takes to settle at a new power level after a change in its clock frequency. So for this step I simulated the miners. I fed the measured GPU power into a model in which the miners change their power, with a delay, to offset changes in GPU power. A capacitor bank supplies or absorbs whatever the miners have not yet offset.
In the model, the miners' delay is set by a time constant. A miner with a time constant of 1 second completes the middle 80% of a change, from 10% to 90% of it, in about 2.2 seconds. I ran the model with time constants from 0.2 to 5 seconds. The results below use a time constant of 1 second.
There are two ways to size the capacitor bank's energy storage, and they give different answers:
- The smaller size is the most energy the bank must supply, or absorb, in one direction before the flow of energy reverses. Every bank must be at least this large, so this size is a lower bound.
- The larger size is the full range of the bank's charge over the hour, for a bank that supplies or absorbs every difference and is never recharged by any other means. This size is an upper bound.
These are the results:
- Without the miners responding: the larger size is about 3.1 Wh per GPU on the chat hour. The smaller size is about 0.08 Wh.
- With the miners responding: the larger size falls to about 0.078 Wh per GPU, which is about 280 J and about 40 times less. The smaller size falls to about 0.041 Wh, which is about 147 J and about 2 times less. On the coding hour, the two sizes are about 410 J and about 240 J.
- Across 128 GPUs: when many GPUs serve independent streams of requests, a rise on one GPU often coincides with a fall on another, so part of the change cancels. With 128 GPUs whose changes are independent of each other, the larger size falls to about 25 J per GPU for chat and about 42 J per GPU for coding. The smaller size falls to about 9.5 J and about 18 J.
- The capacitors' power rating: with time constants of 0.2 seconds or longer, the fastest changes end before the miners can respond. Across all the time constants and fleet sizes I ran, the miners changed the capacitors' power rating by at most about 17%, upward or downward. On the chat hour with one GPU and a time constant of 1 second, the power rating rose by about 4%, from 265 W to 276 W. A larger fleet reduces the power rating, because more of the fast changes cancel. My sensor cannot resolve time constants below 0.2 seconds. If a mining chip responds much faster than that, the miners might also reduce the power rating. The second experiment will show how fast the chip responds.
These are the conditions that apply to every figure in this section:
- The miners in the simulation are a model. No mining chip was measured.
- The capacitor bank is idealised. It responds instantly, loses no energy and has no charge limit.
- The 128-GPU figures assume that the GPUs' changes in power are independent. GPUs in one data center may change power at the same time, for example when a burst of requests reaches the whole fleet at once. Then less cancels, and more storage is needed. Nobody has yet measured how closely the power of real GPUs in one fleet moves together.
- The figures use a sensor that changes value every 100 ms. The true fast changes are at least as large as the measured ones.
NVIDIA states that its Vera Rubin NVL72 racks include about 400 J of energy storage per GPU to smooth power. That is the same order of magnitude as my single-GPU figures with the miners responding. The agreement does not confirm my numbers, because NVIDIA's figure is a vendor's statement about a different GPU.
Next
The simulation depends on how fast a mining chip can change its power. The second experiment measures that on real hardware.
