Bit #20: Groundwater Depletion of the High Plains Aquifer: Overuse, Climate Change and Global Implications
Originally published on Medium on August 10, 2022.
I wrote this paper in 2019 as part of requirements for my PhD. Given the gobal droughts we are seeing now, it’s evermore clear that climage change is not just a climate crisis, it is a water crisis. My hope is that the layreader will be able to make some fundamental connections using the High Plains Aquifer as an example. The HPA reflects the global connections between climate change, water resource overuse, globalization and the need for transformative societal change. I think even just reading the introduction and conclusion sections, you’ll be able to see that droughts, water resource depletion and economic growth are already having adverse effects in this post-1 degree C warming world. Don’t let this paralyze you. Instead, let it be a call to action. What changes are needed within your community? Start there.
Introduction
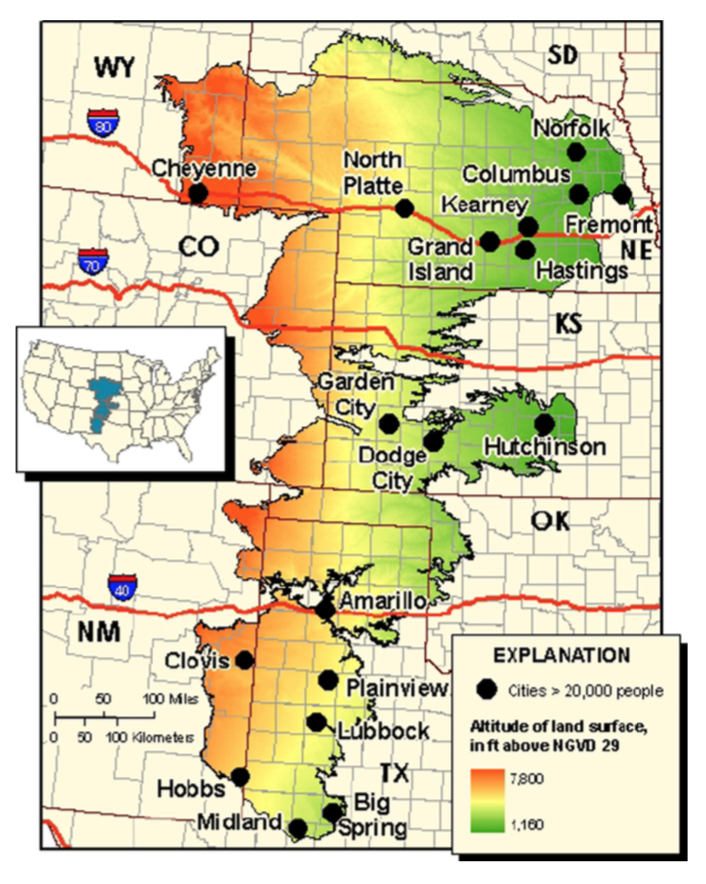
Figure 1. The High Plains Aquifer. Source: U.S. Geological Survey (2013), M. R Sanderson, R S. Frey (2015).
The High Plains Aquifer (HPA) spans eight states: Nebraska, Kansas, Texas, Wyoming, South Dakota, Colorado, Oklahoma, and New Mexico (Fig. 1). It is the largest aquifer in the United States (49). However, much of the focus on the HPA is in the regions located in Nebraska, Kansas, and Texas. The aquifer comprises 174,000 square miles and was formed over 65 million years ago as a result of deposited Rocky Mountain sediment that was transported via the Mississippi River (31, 49).
The HPA is not a single continuous aquifer, but rather is made of a number of connected hydrologic units that contain clay, silt, sand and gravel porous media (31, 4). The original source of water in the HPA came from winter runoff from Rocky Mountain streams but this is no longer true (49). Today, the HPA is primarily recharged from surface water from playas and where irrigation occurs, irrigation recharge (49). In the northern portion of the HPA, groundwater recharge is mainly diffuse while in the southern portion it is mainly focused recharge (34).
The HPA exists in a semi-arid continental climate, with moderate precipitation (less than 19 inches) annually in the majority of the region (49). The climate provides relatively low humidity and relatively high evaporation rates as well (49). Prior to the discovery of the aquifer, European-American explorers dubbed the region, “The Great American Desert” (23, 49). However, with the discovery of the aquifer in the 19th century, the region was no longer seen as a desert, but as land fertile for agricultural development. Irrigation began in the late 1800s and with advances in technology escalated through the 1980s (19, 38, 53). In particular, the HPA supports corn and cattle-dominated agricultural and livestock industries, which are intrinsically intertwined due to corn’s extensive use in cattle feedlots (53). Thus, the region is home to the second largest inventory for cattle on feed, greatly surpassing revenue from other agricultural sectors (53).
Today, the High Plains region is 39% cultivated cropland and approximately 30% of the cropland is irrigated (49). The HPA is well known as one of the “breadbaskets of the world”. Unfortunately, it is also ranked number one in terms of groundwater withdrawals in the United States, and groundwater depletion of the HPA is of major concern for the country (49).
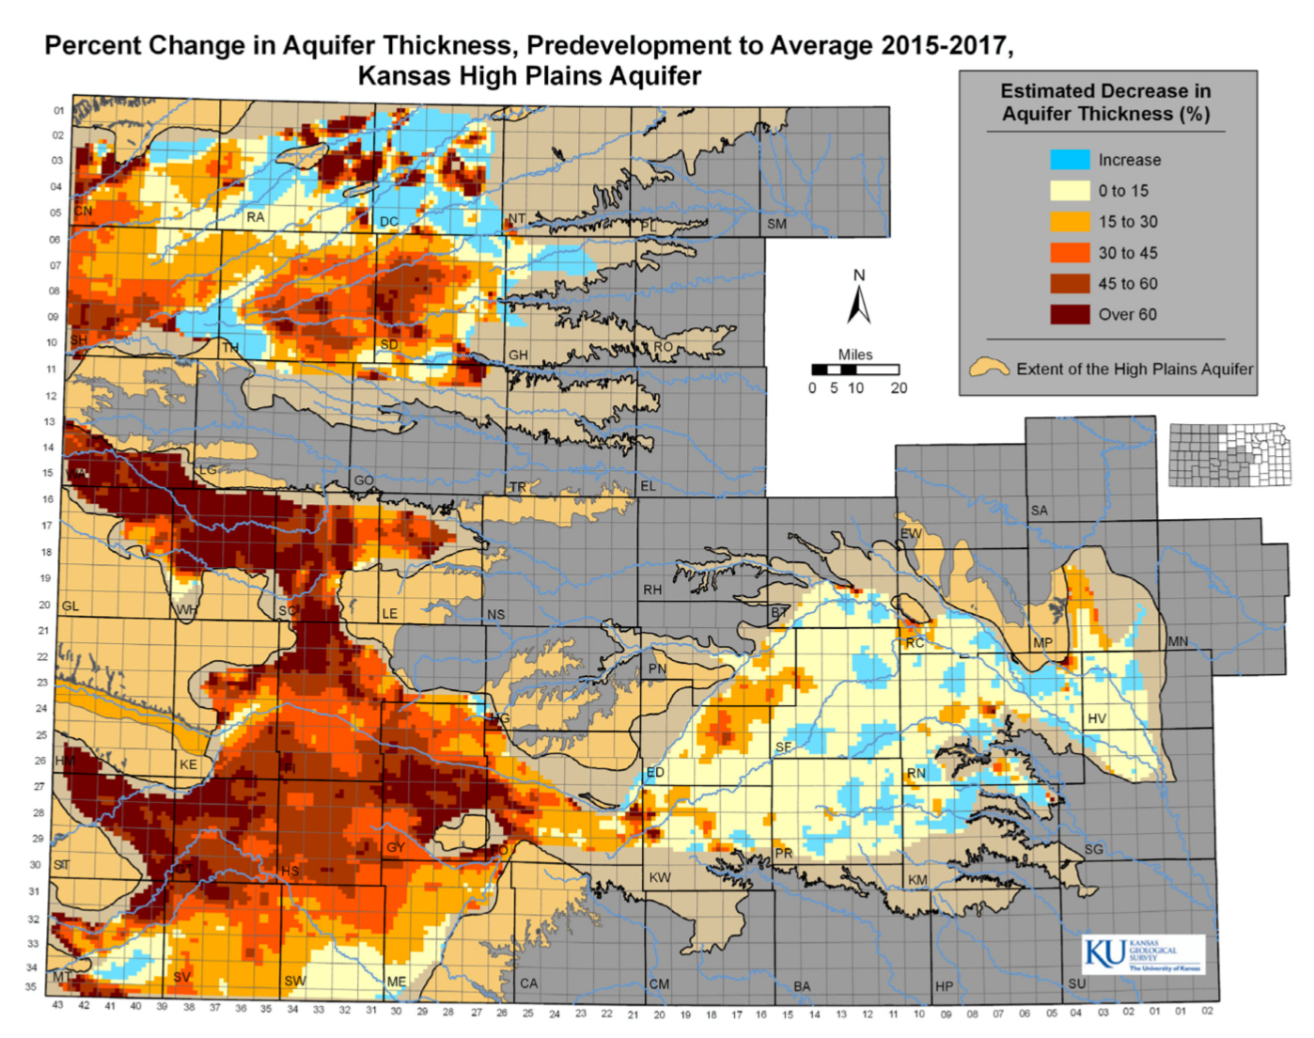
Figure 2. Declines in Kansas HPA aquifer thickness from predevelopment to winter conditions for 2015–2017. Areas that show increase are not used in groundwater development and are ignored in the examination of depletion. Source: Whittemore, Butler, & Wilson (2018).
Despite advances in technology during the 1940s, until the 1960s 97% of predevelopment groundwater storage was still in existence (53). Since then, groundwater storage has depleted so that only 70% of the predevelopment groundwater storage remains (53, Fig. 2). According to one study, this decline is projected to continue over the next 100 years and beyond unless pumping of the HPA is reduced and becomes sustainable (53). The HPA is not alone, there are many aquifers globally that support irrigated agriculture and that are facing rapid depletion (3, 4, 5 49). Continued depletion in the HPA threatens food security at both the local, national and global level due its involvement in the global food trade. For semi-arid located aquifers, the best solution is to reduce the rate of depletion and extend the lifetime of the aquifer (26). This will be discussed in further detail below.
Groundwater depletion
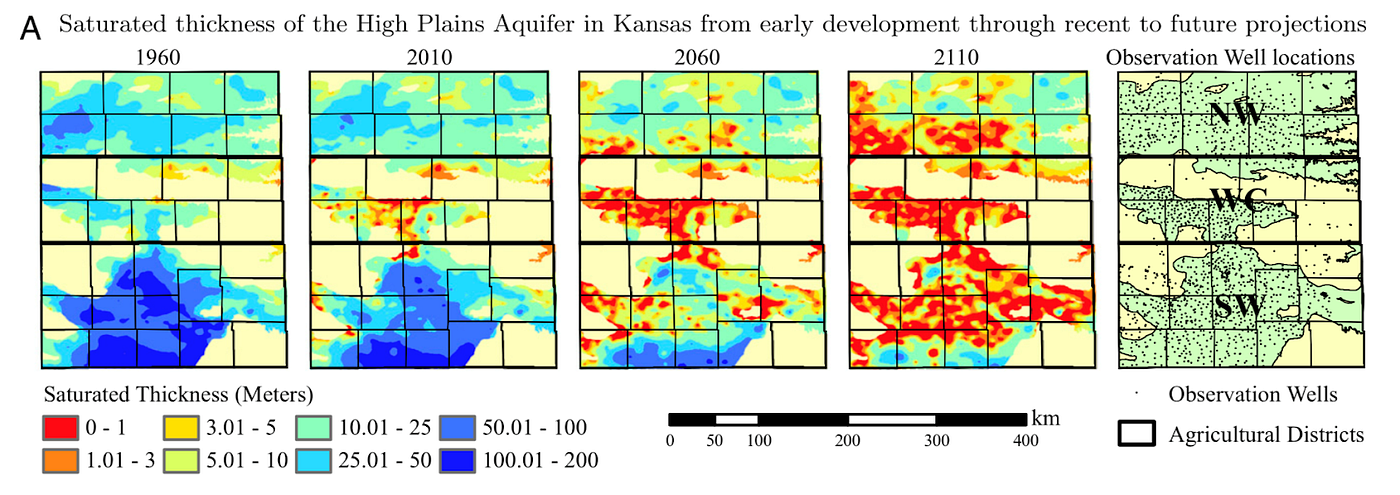
Figure 3. Saturated thickness of the HPA in Kansas from 1960–2110. Source: Steward et al. (2013).
The issue of groundwater depletion in the HPA is well-studied from scientific, engineering, economic, and sociological perspectives (11, 26, 45, 49, 53, 57). From Theis, we know that groundwater removal through well withdrawals will inevitably result in removal of water from storage in porous media (26, 55). While over-pumping to support irrigation is the primary driver of groundwater depletion in the region, the northern portion of the HPA has largely been untouched due to higher recharge rates than in the central and southern portions (49).The northern region of the HPA has approximately 10 times more recharge than in the central and southern regions (49). Still, research suggests that up to 70% of the aquifer will be depleted by 2070 if current trends remain the same (45). When combined with groundwater depletion in the California Central Valley (CCV), the HPA and the CCV make up approximately half of the groundwater depletion in the United States since 1900 (49). With only annual precipitation recharge, a depleted HPA would require 500 to 1,300 years to be replenished (45, 53). One suggested cause of an increase in groundwater depletion since the mid-1940s is due to improvements in both drilling and well pumping technology, in the electrification of rural areas, and economic growth (26).
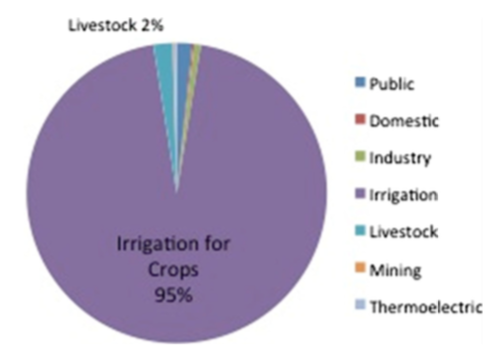
Figure 4. Groundwater consumption in the HPA, 2005. Source: U.S. Geological Survey (2005), M. R. Sanderson, R.S. Frey (2015).
Kansas and Texas are the primary homes of the central and southern portions of the HPA where the greatest depletion has occurred (Fig. 3). In the western Kansas congressional district, the agricultural industry has the highest total market value of agricultural products in the entire United States (53). Overall, the HPA supports a $35 billion agricultural industry (49). The vast majority of groundwater from the HPA is used for irrigation purposes (95% for irrigation, 2% livestock) (45), suggesting there is a clear economic tie to overuse in the region (Fig. 4). One study predicted that given depletion over the past decade (1997–2007), there would be a loss of saturated thickness with thickness decreasing to less than 6 meters within 30 years, ultimately making the region unsuitable for irrigation (49). In these regions of the HPA, groundwater depletion shows water level declines of greater than or equal to 30 meters (17,000 km² area), exceeding recharge by a factor of 10 (49).
Groundwater depletion is not only a concern for food and water security, it also has a negative impact on the region’s ecosystem. As mentioned, the northern HPA (located in Nebraska) has only seen a small decrease in groundwater (about 1%) (49). However, the aquifer in this region is closely tied to the surrounding rivers. With only this tiny decline in the water table, the local rivers such as the Platte have seen a decrease in groundwater discharge of up to 50% (30, 40, 49). The central and southern portions of the aquifer function differently from the northern, thus despite the higher decline in groundwater, the surface water systems are not affected in the same way (49).
Thus, the HPA’s groundwater depletion is highly variable spatially. Moreover, we can consider the northern region to be renewable given the high recharge rates and low depletion since the onset of late 19th century agriculture in the region. However, the central and southern portions are considered fossil groundwater resources, because of the high depletion and the lower recharge rate. The lifespan of the fossil groundwater varies spatially as well. In just 4% of the total land area of the HPA, there is approximately 35% depletion (49). One study predicts a lifespan of 630 years for the HPA (fossil water only) but some regions have much shorter lifespans, such as 240 years in Kansas and 140 years in Texas (49).
It is understood that recharge in irrigated portions of the HPA comes from irrigation water recycling (49). However, one study questions how well excess irrigation recharges the aquifer (49). They suggest that the fine-grained soils of the central HPA actually prohibit recharge (47, 48, 49). As a result, we could be overestimating recharge from this source.
There are many more negative effects from groundwater depletion. These range from effects on pumping (well yields, costs, deeper drilling) to changes in the topography (land subsidence, reduced flow surface water bodies, loss of wetlands) (14, 26). These changes can be costly due to infrastructure damage and contamination of groundwater as the water table becomes increasingly lower (26). Other costly effects from groundwater depletion result from reduced heads requiring more energy to lift the water (26). Thus, for the same amount of water extraction required, more energy and cost will be needed compared to when the groundwater levels were higher (26).
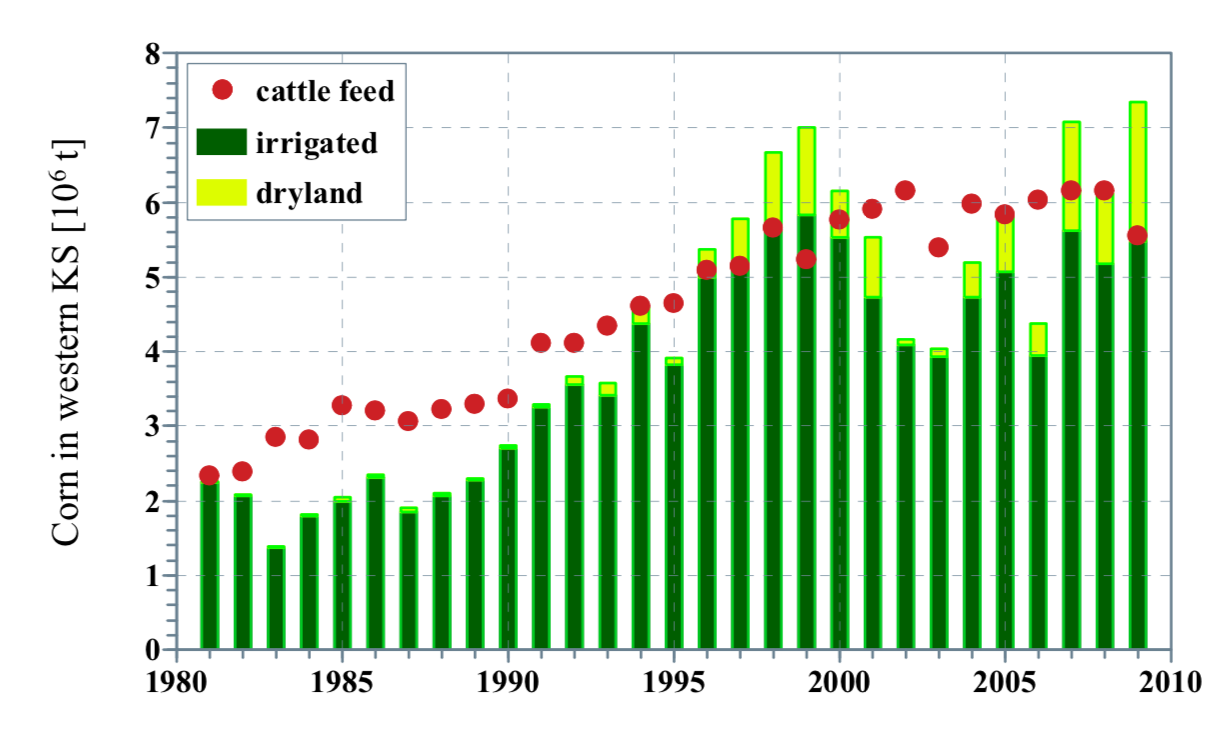
Figure 5. Cattle production in western Kansas and corn requirements for feed. Until the 1980s, Cattle feed requirements (from corn) were higher than corn production. The primary source of corn is through irrigation. Source: Steward et al. (2013)
Kansas is a prime example of the political and economic challenges that make returning the aquifer to more sustainable pumping levels difficult. Here, agriculture is closely integrated with cattle feedlots that use irrigated corn as feed (53). Because cattle consumption is much greater than dryland corn production, increases in irrigated corn production were needed to maintain livestock (53, Fig. 5). Even though groundwater pumping rates have peaked (53), which would signal to the corn and cattle producers that a change in behavior is necessary for future sustainability of the aquifer for livestock production, thanks to increased water efficiencies, there will not be noticeable effects for another 30–40 years (53), meaning that when groundwater depletion is entering its worse stages, the response from local agricultural industries will likely be too late. This scenario assumes that stakeholders do not begin changing behavior now to reduce pumping and increase the longevity of the aquifer.
A number of studies have looked at reduction requirements for increasing the lifetime of the HPA (15, 16, 53, 57). Golden found that a reduction of 15–20% would limit adverse effects on the agricultural industry’s net income. However, a few studies suggest that reduction would need to be from 27% to 33% and areas with greater declines will need greater reductions (57). One study suggests that 20% reduction would see agricultural production return to 1990s levels and would extend peak production to the 2070s and improve production beyond that (45). The same study also discussed higher reduction scenarios, such as 40% and 60–80% reductions (80% approaches regional recharge requirements) (45). They suggest that the long-term effects of the reductions would ultimately see increases in corn and cattle production, thus creating more sustainable aquifer usage for an increasing population. However, if the region reduced pumping by 80%, the cattle industry could only sustain 12% of today’s cattle population (45). This suggests that changes of this magnitude require major societal changes to occur in order to make these reductions feasible (i.e., eating less beef and government subsidies to incentivize cattle companies to scale back production). From an ecological perspective, since the aquifer can be seen as a “common pool resource” used to support irrigated agriculture, the HPA is suffering from the “tragedy of the commons” (and globally this appears to be the case for over-pumped aquifers) (52, 53).
One study suggests that the economy and the natural environment are in conflict due to the mining of a fossil water resource (45). The issue results from the direct economic impact of producing irrigated agriculture such that a reduction in groundwater withdrawal is equivalently realized in the agriculturalist’s living standards (45). The same study also suggests that control over demand is shared unequally among those who produce agriculture and those who consume it. In particular, the consumers tend to be higher income which puts them in an unequal exchange relation (45). The author also suggests that while local attempts at management have happened in the region, the issue of sustainable management is actually a global issue because prices are set in national and international markets (45). Thus, the living standards for agricultural producers in the HPA depend on depleting the aquifer to meet non-local demand (45). Ultimately, significant steps must be taken to address groundwater depletion in the HPA to ensure future water and food security (26).
Global connection
According to one study, global water usage has increased 300% since the 1950s (18, 26) and about 75% of the world’s freshwater resources are used for irrigation purposes (2, 42). Globalization of the food trade complicates the driver of groundwater depletion in the HPA and in other aquifers around the world. On a global scale, groundwater depletion increased 22% from 2000 to 2010 (11). The global depletion rise occurred primarily in India (23%), China (102%) and in the US (31%) with the HPA and the California Central Valley contributing the most to US-based depletion (3,49).
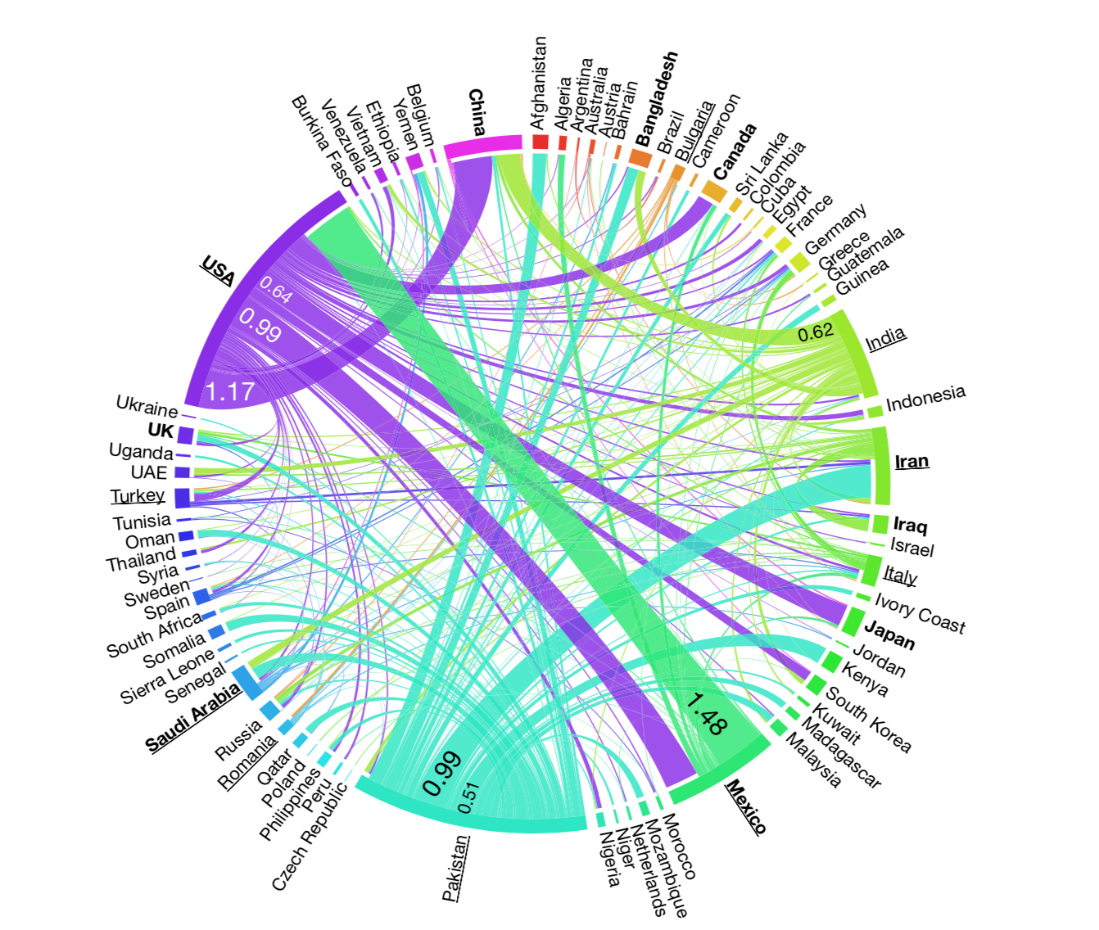
Figure 5. Groundwater depletion embedded in international trade. The US is highlighted as both a top ten importer and top ten exporter (bold and underlined respectively). Purple ribbons show US exports. Source: Dalin et al. (2017)
The United States has three major trade partners: China, Mexico and Japan with cotton (24%), wheat (16%), maize (10%) and soybeans (9%) dominating the commodity export trade (Fig. 5). Soybean exports to China have increased due to increasing feed demand in that country (11) and while these exports are considered water-efficient (9, 10, 11), they are also responsible for 65% of groundwater depletion (11). The effects of groundwater depletion in the international food trade is two-fold. First, the international demand for exports from the US encourages further depletion, contributing locally to an unsustainable industry. Second, those that are importing from the US (and other countries with groundwater depletion tied to the food trade) are putting their own food security at risk when they depend on an unsustainable food source. Moreover, many of the counties that import food are facing water scarcity issues and may not have the ability to replace drops in imports due to depletion (11).
Support for growing populations, particularly in China, through the international food trade is also contributing to local groundwater depletion in the United States (including the HPA) (11). From 2000 to 2010, groundwater depletion exports increased by 57% in the United States with the majority of these exports going to China (11). China’s growth in population and increased demand for meat requires that they import more soybean to feed livestock (11*, 11). Growing demand both on a local (recall from the previous section that the HPA supports the second largest livestock sector in the US) and global level for meat are thus serious contributing factors to the depletion of groundwater, and more research in this area is needed.
The global implications of groundwater depletion not only affect food security. A result of groundwater depletion is its contribution to rising sea levels. The vast majority of depletion ends up in the oceans and it is such that U.S. depletion of groundwater was found to contribute 1.4% of observed sea level rise in the last 108-year period (56, 25, 26). Today, we tend to focus on contributions to sea level rise from carbon emissions due to burning of fossil fuels, but the continued extraction of water (especially fossil groundwater such as in the central and southern HPA) also had deleterious effects for coastal communities. Not only are these effects damaging to structures along the coast, but also are contributing to sea-water intrusion into coastal aquifers.
Effects of climate change on future depletion trends
Understanding the direct and indirect effects of climate change (not just anthropogenic climate change) on groundwater is inherently difficult because of the long depletion times that range from days to thousands of years or more (18). Moreover, delineating effects from climatic versus human stresses is also difficult to quantify because climate affects both human demand and groundwater recharge (18).
Intuitively, we expect shallower aquifers to respond more quickly to changing climate conditions because water travel time through the soil is shorter than with deeper aquifers, and would anticipate that deep aquifers are more sensitive to interannual and longer-term climate variation (12, 18). However, even deep aquifers demonstrate immediate local impacts on groundwater mass changes (5, 44, 50). A few studies have looked at the effects of climate-induced pumping (4, 18, 44).
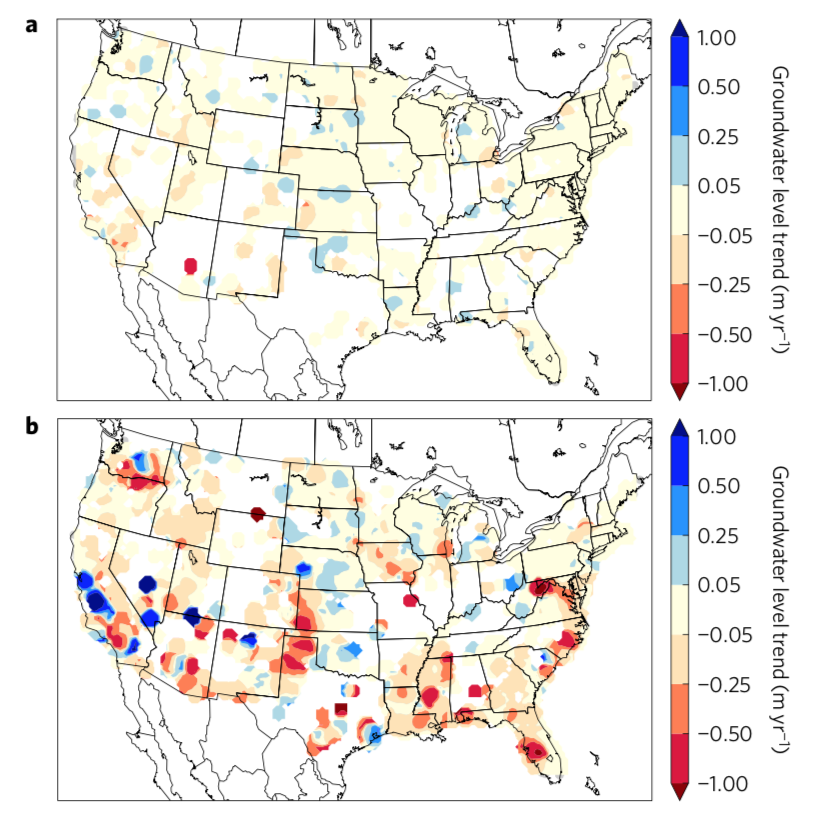
Figure 6. Climate-induced pumping and groundwater level changes. a) shows groundwater level trends for shallow wells (< 30 m) and b) shows trends for average groundwater level rates for deep wells ( > 30 m). Source: Russo and Lall (2017)
Climate-induced pumping occurs when climate conditions cause humans to pump more water out of an aquifer in response to altered conditions (Fig. 6). One study found a relationship between climate-induced pumping and precipitation variability that is linked to sea surface temperatures’ warming patterns over the Indian ocean (7). Other studies have shown that multi-year or decadal climate patterns such as the Pacific Decadal Oscillation and the El Nino Southern Oscillation have also had effects on a number of aquifers globally (20, 22, 27, 44, 54). Not all aquifers respond the same to climate variability. Key factors that contribute to an aquifer’s response are local geology, land use and land cover as well as infiltration and recharge rates (7, 44, 47).
One study looked at response to inter-annual and decadal climate variations on small, moderate, and deep aquifers (8). Here, they found that small and medium groundwater aquifers had a strong connection to the El Nino Southern Oscillation and to the Pacific Decadal Oscillation (27, 44). For the deepest wells, there was even stronger connection with the El Nino Southern Oscillation and the North Atlantic Oscillation, and this connection increased with depth (44). This seems to contradict our previously defined intuition about travel times and aquifer depth, but the study determined that responses to these climate variations were nearly synchronous with the events themselves, and that human response to the oscillations in wet and dry periods led to the deep aquifer’s response (44). In particular, they found that aquifers that had the strongest one-year groundwater response to precipitation were associated with the HPA and the Mississippi Embayment (44). Prior to this study, research had shown a stronger influence on groundwater from irrigation pumping than climate-induced pumping (13, 29, 44) but this study suggests that researchers have been conservative in their conclusions because they did not look at the interannual effects just discussed (44).
Natural climate variations can induce pumping in response to changes in precipitation and have a direct effect on aquifers like the HPA (increased precipitation leads to less pumping and less precipitation leads to more pumping). These climate variabilities are known and predictable. However, climate change due to increased carbon dioxide emissions (from burning of fossil fuels) is projected to increase variability in climate. Given the findings of the previous studies on climate-induced pumping, we can extrapolate that these new human-caused variations in the climate will lead to changes in groundwater levels. For the remainder of this section, we look at the effects of climate change on groundwater recharge on the HPA.
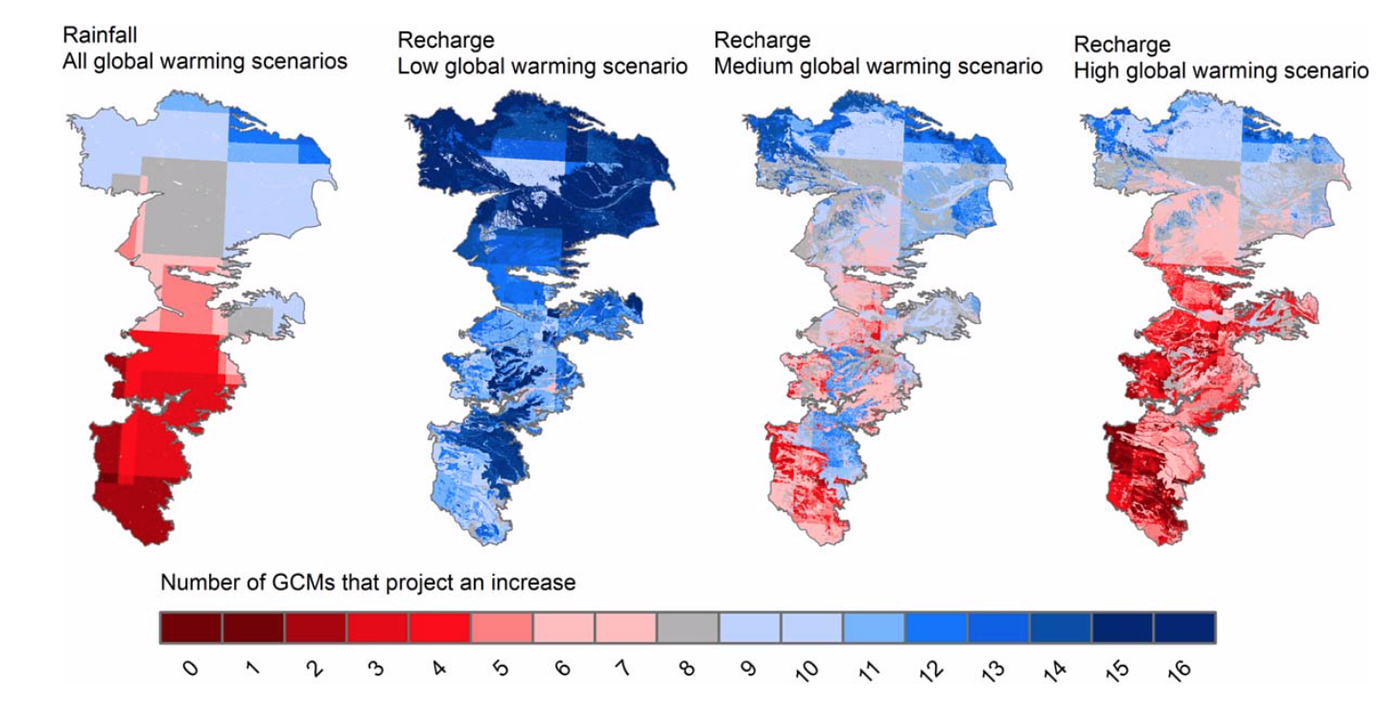
Figure 7. Spatial distribution of total number of GCMs that show an increase in rainfall or recharge in the HPA for different warming scenarios. Source: Crosbie et al. (2013)
In general, we expect temperatures to rise in the western United States (34). Warmer temperatures during winter and early spring are expected to shift winter precipitation away from snow and toward rain as well as move the rain-to-snow transition to higher elevations (34). A direct result of higher temperatures is an increase in potential evapotranspiration (34). Precipitation decreases are expected to affect the HPA region especially during the late summer (34). The western US climate is also projected to experience more intense flooding events and droughts (17, 24, 33, 34, 35, 36). Studies of climate change effects on HPA recharge show a spatial variation with moderate increases in the northern and moderate decreases in the southern HPA (8, 34, 37, 43, Fig. 7). The result of decreases in recharge due to climate change is further worsening of water shortages due to groundwater depletion (previously discussed in this paper). Changes in precipitation may cause a net decrease in diffuse recharge across the HPA and possibly an increase in diffuse recharge in the northern HPA (34). It is currently unclear how change in precipitation will affect focused recharge, but even net gains in focused recharge are not expected to offset decreases in diffuse recharge (8, 34, 37). Uncertainty in projections of precipitation as well as limited understanding of how to use coarse-resolution climate, land surface, and hydrologic model outputs contribute to the lack of understanding of precipitation effects on focused recharge (34, 37, 41).
In portions of the HPA that sustain irrigation, there is an expected increase in irrigation recharge (8, 21 34) but also that the ultimate result of irrigation in the HPA leads to a net loss of groundwater storage (34, 51). However, the ultimate effects on groundwater recharge are unclear because of high uncertainty in the human ability to adapt to changing climates (34).
One study projected increased rainfall for the northern HPA and decreased rainfall for the southern HPA (44). This same study also found a high sensitivity in recharge to potential evapotranspiration. At the lower warming scenario (1.0 deg C), potential evapotranspiration decreased slightly, but for the higher scenario (2.4 deg C), they found an increase in evapotranspiration (44). This suggests that once the globe surpasses 1.0 deg C warming, we can expect recharge to reduce in the HPA (1, 8, 28). Climate projections for the Nebraska Sand Hills region of the HPA seem to support this idea (28). In this paper, the authors suggest that a tipping point exists between 1.0 deg C and 2.4 deg C warming for the Northern High Plains and that once 1.0 deg C warming is passed, irrigation and diffuse recharge will see significant changes (28). In particular, higher warming led to statistically significant changes in annual precipitation, irrigation demands, evapotranspiration and recharge rates for the northern HPA region (1, 8).
Furthermore, median annual evapotranspiration increased as much as 25% while median annual recharge rates decreased as much as 95% for the northern HPA at higher warming scenarios leading to a 15% increase in irrigation demands compared to the historical annual averages (28). Yet, precipitation remained statistically unchanged compared to the historical 1990 values for portions of the northern HPA (28). The end result of these projections is higher stress on the northern HPA, a region of the aquifer that today is considered a renewable source of water due to its current high recharge rates.
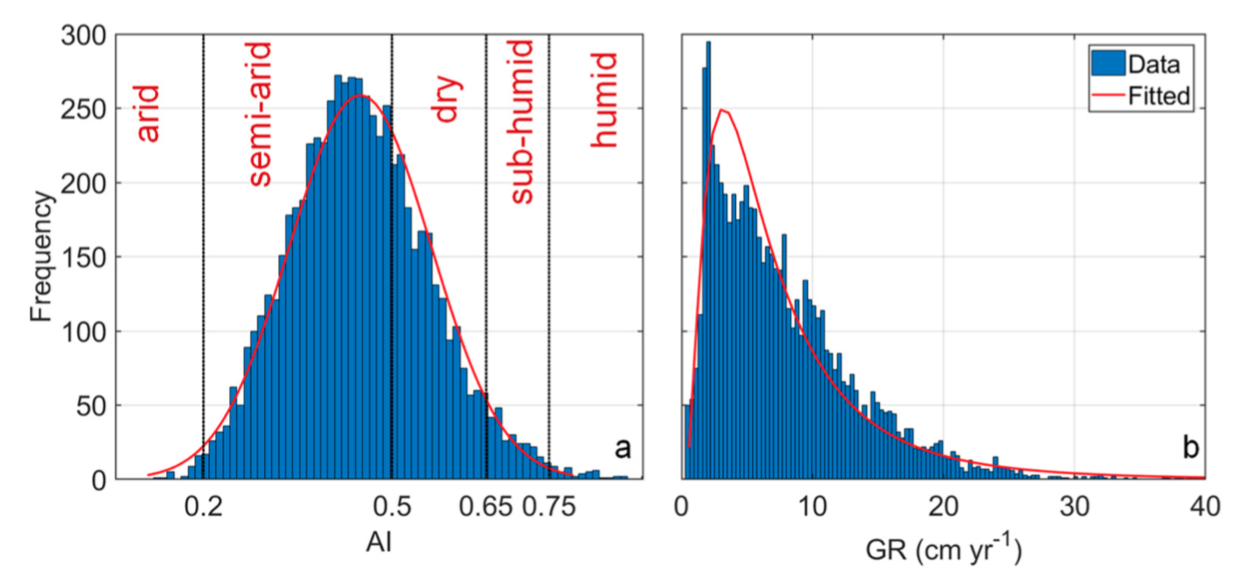
Figure 8. a) Probability distribution showing chance of changing climate from semi-arid to something else and b) shows groundwater recharge rates for the Nebraska Sand Hills’ aquifer (northern HPA). Source: Adane et al (2019)
The clear emerging factor in recharge sensitivity to climate change is evapotranspiration (1, 8, 28). In a study that looked at recharge in the Nebraska Sand Hills, the authors used an aridity index (AI = Precipitation/Evapotranspiration) to quantify the effects of evapotranspiration and precipitation in warming climate scenarios. Using this index, they determined probabilities for the climate of the northern HPA shifting from semi-arid to arid (26% chance, Fig. 8) (1). They also found that recharge rates will decrease significantly under the higher warming scenarios (especially RCP. 8.5) (1).
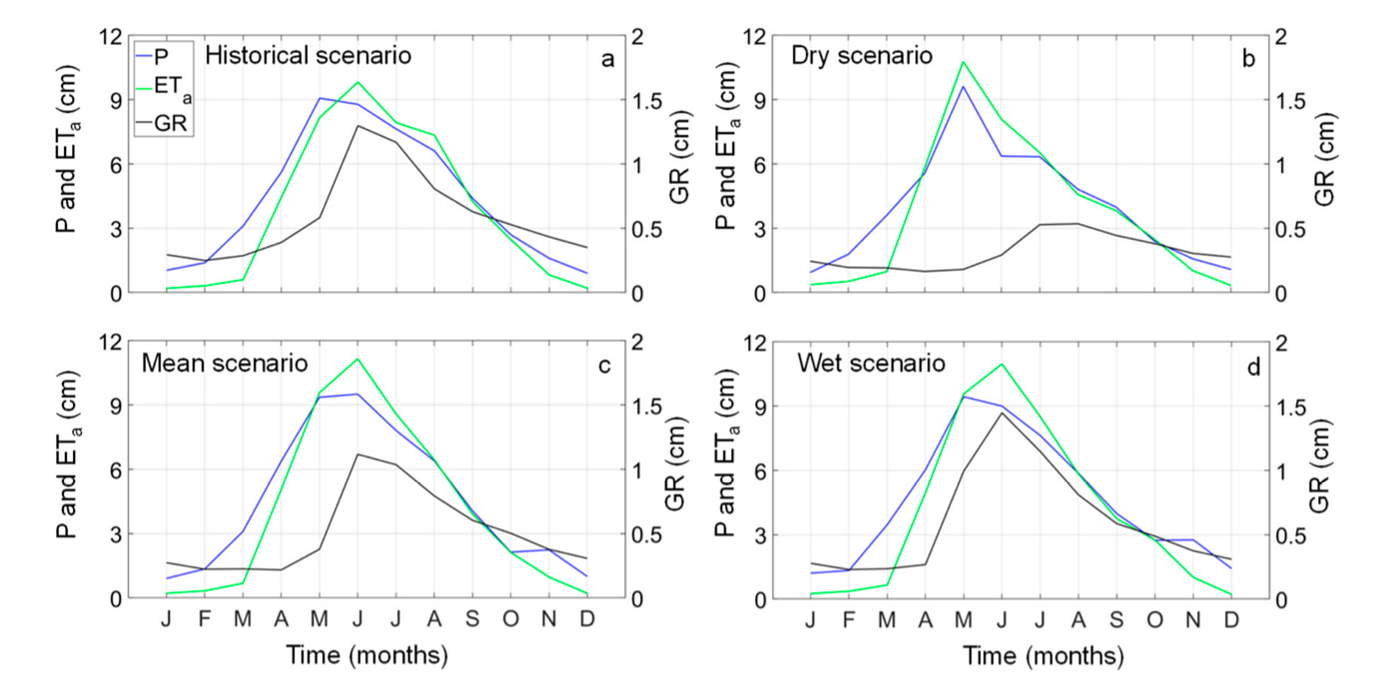
Figure 9. Monthly averages for historical, wet, mean and dry scenarios showing changes in precipitation, evapotranspiration and groundwater recharge. Source: Adane et al. (2019)
This study went further and looked at monthly projected precipitation distributions, and found that dry climate projections show a 25% decline in summer month precipitation and thus a 60% loss in groundwater recharge rates during the same period (1). The summer months are the primary season for groundwater replenishment in the HPA (1). The study also found a significant decrease in precipitation during the spring months, which is a secondary important time for recharging the aquifer (1, Fig. 9). They suggest that a decrease in AI will not only affect recharge of the HPA, but that it will also affect plant survival (1). The authors found a doubling of wilting point probabilities (4.3% to 8.5%) and that under the dry scenario, the no-stress probability was reduced from 48.8% to 35.1% (1). These changes raise concern about possible desertification of the HPA region (1). More research is needed to better understand the relationship between recharge and evapotranspiration under a warming climate and the effects this will have on food and water security and the global food trade.
Conclusion
Unsustainable groundwater depletion in the High Plains Aquifer will have deleterious effects on both the local, national, and global scales. The global increase in demand for meat products seems to be driving the increase in production of soy and corn in the HPA. The HPA is well-integrated into the global food-trade, meaning that global market prices are a driving force for continued local depletion but also that the depletion of the HPA would lead to food security issues on a global scale. Coupled with the effects of future climate scenarios, we need more studies that take a holistic look at what the future of water and food security in the United States and beyond will be like by the end of the century.
Somewhat concerning was finding that very recent studies made projections using climate scenarios that were on the low end of warming (such as 1.0 deg C and 2.4 deg C) only. Today, in 2019, we have already reached the low climate warming scenario of 1.0 deg C with Mauna Loa reporting CO2 at 410.27 ppm in November 2019. Recently, we learned that emissions are projected to have increased 0.6% in 2019 (39, 58), meaning we are not yet at peak emissions. Coupled with a possibility that a tipping point exists between 1.0 deg C and 2.4 deg C warming, it is imperative that future studies include higher emission scenarios to make better mid-century projections.
The obvious solution to groundwater depletion is to reduce pumping as many studies have suggested. Like climate change, the driver for avoiding reduction in pumping is economic. Whole societal changes are presently needed in order to extend the life span of the HPA, but changes are hampered because of the deep connection of standard of living to economic losses. Water is essential for life and in an increasingly warmer world, water will play an even bigger role in human life. Stakeholders must face these challenges now in order to prevent potentially worse economic losses and declines in standard of living due to inaction.
References
- Adane, Zablon, et al. “Sensitivity of Potential Groundwater Recharge to Projected Climate Change Scenarios: A Site-Specific Study in the Nebraska Sand Hills, USA.” Water 11.5 (2019): 950.
- Anandhi, Aavudai, and Narayanan Kannan. “Vulnerability assessment of water resources–Translating a theoretical concept to an operational framework using systems thinking approach in a changing climate: Case study in Ogallala Aquifer.” Journal of hydrology 557 (2018): 460–474.
- Aeschbach-Hertig, Werner, and Tom Gleeson. “Regional strategies for the accelerating global problem of groundwater depletion.” Nature Geoscience 5.12 (2012): 853.
- Asoka, Akarsh, et al. “Relative contribution of monsoon precipitation and pumping to changes in groundwater storage in India.” Nature Geoscience 10.2 (2017): 109.
- Butler Jr, James J., et al. “Sustainability of aquifers supporting irrigated agriculture: a case study of the High Plains aquifer in Kansas.” Water international 43.6 (2018): 815–828.
- Bredehoeft, J. D. “Monitoring regional groundwater extraction: the problem.” Groundwater 49.6 (2011): 808–814.
- Chen, Zhuoheng, Stephen E. Grasby, and Kirk G. Osadetz. “Relation between climate variability and groundwater levels in the upper carbonate aquifer, southern Manitoba, Canada.” Journal of Hydrology 290.1–2 (2004): 43–62.
- Crosbie, Russell S., et al. “Potential climate change effects on groundwater recharge in the High Plains Aquifer, USA.” Water Resources Research 49.7 (2013): 3936–3951.
- Dalin, Carole, et al. “Evolution of the global virtual water trade network.” Proceedings of the National Academy of Sciences 109.16 (2012): 5989–5994.
- Dalin, Carole, et al. “Water resources transfers through Chinese interprovincial and foreign food trade.” Proceedings of the National Academy of Sciences 111.27 (2014): 9774–9779.
- Dalin, Carole, et al. “Groundwater depletion embedded in international food trade.” Nature 543.7647 (2017): 700.
- Dickinson, Jesse E., et al. “A screening tool for delineating subregions of steady recharge within groundwater models.” Vadose Zone Journal 13.6 (2014).
- Ferguson, Ian M., and Reed M. Maxwell. “Human impacts on terrestrial hydrology: climate change versus pumping and irrigation.” Environmental Research Letters 7.4 (2012): 044022.
- Galloway, Devin L., David Richard Jones, and Steven E. Ingebritsen. Land subsidence in the United States. Vol. 1182. US Geological Survey, 1999.
- Golden, Bill. “Monitoring the impacts of Sheridan county 6 local enhanced management area.” (2016).
- Golden, Bill, and Kellen Liebsch. “Monitoring the Impacts of Sheridan County 6 Local Enhanced Management Area: Interim Report for 2013–2016.” (2017).
- Groisman, Pavel Ya, et al. “Trends in intense precipitation in the climate record.” Journal of climate 18.9 (2005): 1326–1350.
- Gurdak, Jason J. “Groundwater: Climate-induced pumping.” Nature Geoscience 10.2 (2017): 71.
- Gutentag, Edwin D., et al. Geohydrology of the High Plains aquifer in parts of Colorado, Kansas, Nebraska, New Mexico, Oklahoma, South Dakota, Texas, and Wyoming. Washington, DC: US Government Printing Office, 1984.
- Hanson, Randall T., and Michael D. Dettinger. “GROUND WATER/SURFACE WATER RESPONSES TO GLOBAL CLIMATE SIMULATIONS, SANTA CLARA‐CALLEGUAS BASIN, VENTURA, CALIFORNIA 1.” JAWRA Journal of the American Water Resources Association 41.3 (2005): 517–536.
- Hanson, R. T., et al. “A method for physically based model analysis of conjunctive use in response to potential climate changes.” Water Resources Research 48.6 (2012).
- Holman, Ian Paul, et al. “Identifying non-stationary groundwater level response to North Atlantic ocean-atmosphere teleconnection patterns using wavelet coherence.” Hydrogeology Journal 19.6 (2011): 1269.
- James, Edwin, Stephen Harriman Long, and Thomas Say. Account of an Expedition from Pittsburgh to the Rocky Mountains, Performed in the Years 1819 and’20, by Order of the Hon. JC Calhoun, Sec’y of War: Under the Command of Major Stephen H. Long. From the Notes of Major Long, Mr. T. Say, and Other Gentlemen of the Party. Vol. 1. Longman, Hurst, Pees, Orre & Brown, 1823.
- Karl, Thomas R., and Richard W. Knight. “Secular trends of precipitation amount, frequency, and intensity in the United States.” Bulletin of the American Meteorological society 79.2 (1998): 231–242.
- Konikow, Leonard F. “Contribution of global groundwater depletion since 1900 to sea‐level rise.” Geophysical Research Letters 38.17 (2011).
- Konikow, Leonard F. “Long‐term groundwater depletion in the United States.” Groundwater 53.1 (2015): 2–9.
- Kuss, Amber Jean M., and Jason J. Gurdak. “Groundwater level response in US principal aquifers to ENSO, NAO, PDO, and AMO.” Journal of Hydrology 519 (2014): 1939–1952.
- Lauffenburger, Zachary H., et al. “Irrigated agriculture and future climate change effects on groundwater recharge, northern High Plains aquifer, USA.” Agricultural Water Management 204 (2018): 69–80.
- Loáiciga, Hugo A. “Climate change and ground water.” Annals of the Association of American Geographers 93.1 (2003): 30–41.
- Luckey, Richard R., Duane A. Woodward, and Clint P. Carney. Simulated stream baseflow changes in the Nebraska Platte Basin above US Highway 183 due to reduced groundwater irrigated land after July 1, 1997. Department of Natural Resources, 2007.
- McGuire, Virginia L. Water in storage and approaches to ground-water management, High Plains aquifer, 2000. Vol. 1243. Geological Survey (USGS), 2003.
- McNeill, John Robert. Something new under the sun: An environmental history of the twentieth-century world (the global century series). WW Norton & Company, 2001.
- Meehl, Gerald A., et al. “Trends in extreme weather and climate events: issues related to modeling extremes in projections of future climate change.” Bulletin of the American Meteorological Society 81.3 (2000): 427–436.
- Meixner, Thomas, et al. “Implications of projected climate change for groundwater recharge in the western United States.” Journal of Hydrology 534 (2016): 124–138.
- Melillo, Jerry M., T. T. Richmond, and G. Yohe. “Climate change impacts in the United States.” Third national climate assessment 52 (2014).
- Min, Seung-Ki, et al. “Human contribution to more-intense precipitation extremes.” Nature 470.7334 (2011): 378.
- Ng, Gene‐Hua Crystal, et al. “Probabilistic analysis of the effects of climate change on groundwater recharge.” Water Resources Research 46.7 (2010).
- Opie, John. Ogallala: Water for a dry land. U of Nebraska Press, 2000.
- Peters, G.P., Andrew, R.M., Canadell, J.G. et al. Carbon dioxide emissions continue to grow amidst slowly emerging climate policies. Nat. Clim. Chang. (2019) doi:10.1038/s41558–019–0659–6
- Peterson, Steven M., et al. “Simulation of ground-water flow and effects of ground-water irrigation on base flow in the Elkhorn and Loup River Basins, Nebraska.” Publications of the US Geological Survey (2008): 15.
- Pulido‐Velazquez, David, et al. “Assessment of future groundwater recharge in semi‐arid regions under climate change scenarios (Serral‐Salinas aquifer, SE Spain). Could increased rainfall variability increase the recharge rate?.” Hydrological processes 29.6 (2015): 828–844.
- Qadir, Mansoor, et al. “Non-conventional water resources and opportunities for water augmentation to achieve food security in water scarce countries.” Agricultural water management 87.1 (2007): 2–22.
- Rosenberg, Norman J., et al. “Possible impacts of global warming on the hydrology of the Ogallala aquifer region.” Climatic change 42.4 (1999): 677–692.
- Russo, Tess A., and Upmanu Lall. “Depletion and response of deep groundwater to climate-induced pumping variability.” Nature Geoscience 10.2 (2017): 105.
- Sanderson, Matthew R., and R. Scott Frey. “Structural impediments to sustainable groundwater management in the High Plains Aquifer of western Kansas.” Agriculture and human values 32.3 (2015): 401–417.
- Scanlon, Bridget R., and Richard S. Goldsmith. “Field study of spatial variability in unsaturated flow beneath and adjacent to playas.” Water Resources Research 33.10 (1997): 2239–2252.
- Scanlon, Bridget R., et al. “Impact of land use and land cover change on groundwater recharge and quality in the southwestern US.” Global Change Biology 11.10 (2005): 1577–1593.
- Scanlon, B. R., R. C. Reedy, and J. B. Gates. “Effects of irrigated agroecosystems: 1. Quantity of soil water and groundwater in the southern High Plains, Texas.” Water Resources Research 46.9 (2010).
- Scanlon, Bridget R., et al. “Groundwater depletion and sustainability of irrigation in the US High Plains and Central Valley.” Proceedings of the national academy of sciences 109.24 (2012): 9320–9325.
- Sophocleous, M. “On Understanding and Predicting Groundwater Response Time (Retraction of Ground Water, vol 50, pg 528–540, 2012).” GROUND WATER 52.2 (2014): 322–322.
- Stanton, Jennifer S., et al. “Selected approaches to estimate water-budget components of the High Plains, 1940 through 1949 and 2000 through 2009.” US Geological Survey Scientific Investigations Report 5183 (2011): 92.
- Steward, David R., et al. “Groundwater economics: An object‐oriented foundation for integrated studies of irrigated agricultural systems.” Water resources research 45.5 (2009).
- Steward, David R., et al. “Tapping unsustainable groundwater stores for agricultural production in the High Plains Aquifer of Kansas, projections to 2110.” Proceedings of the National Academy of Sciences 110.37 (2013): E3477-E3486.
- Taylor, Richard G., et al. “Ground water and climate change.” Nature climate change 3.4 (2013): 322–329.
- Theis, Charles V. “The source of water derived from wells.” Civil Engineering 10.5 (1940): 277–280.
- Wada, Yoshihide, et al. “Global depletion of groundwater resources.” Geophysical research letters 37.20 (2010).
- Whittemore, Donald O., James J. Butler Jr, and B. Brownie Wilson. “Status of the High Plains Aquifer in Kansas.” Technical Series 3 (2018).
- Friedlingstein, Pierre, et al. “Global carbon budget 2019.” Earth System Science Data 11.4 (2019): 1783–1838.
